

Real-time traffic data from the cameras you already own
Counts, classification, occupancy, pedestrian and bicycle volumes and origin-destination flows from DOT live camera feeds, toll-lane video and purpose-built cameras. Engineered end to end: camera, network, edge or cloud inference, dashboards and agency feeds.
From a video stream to a number an operator can act on
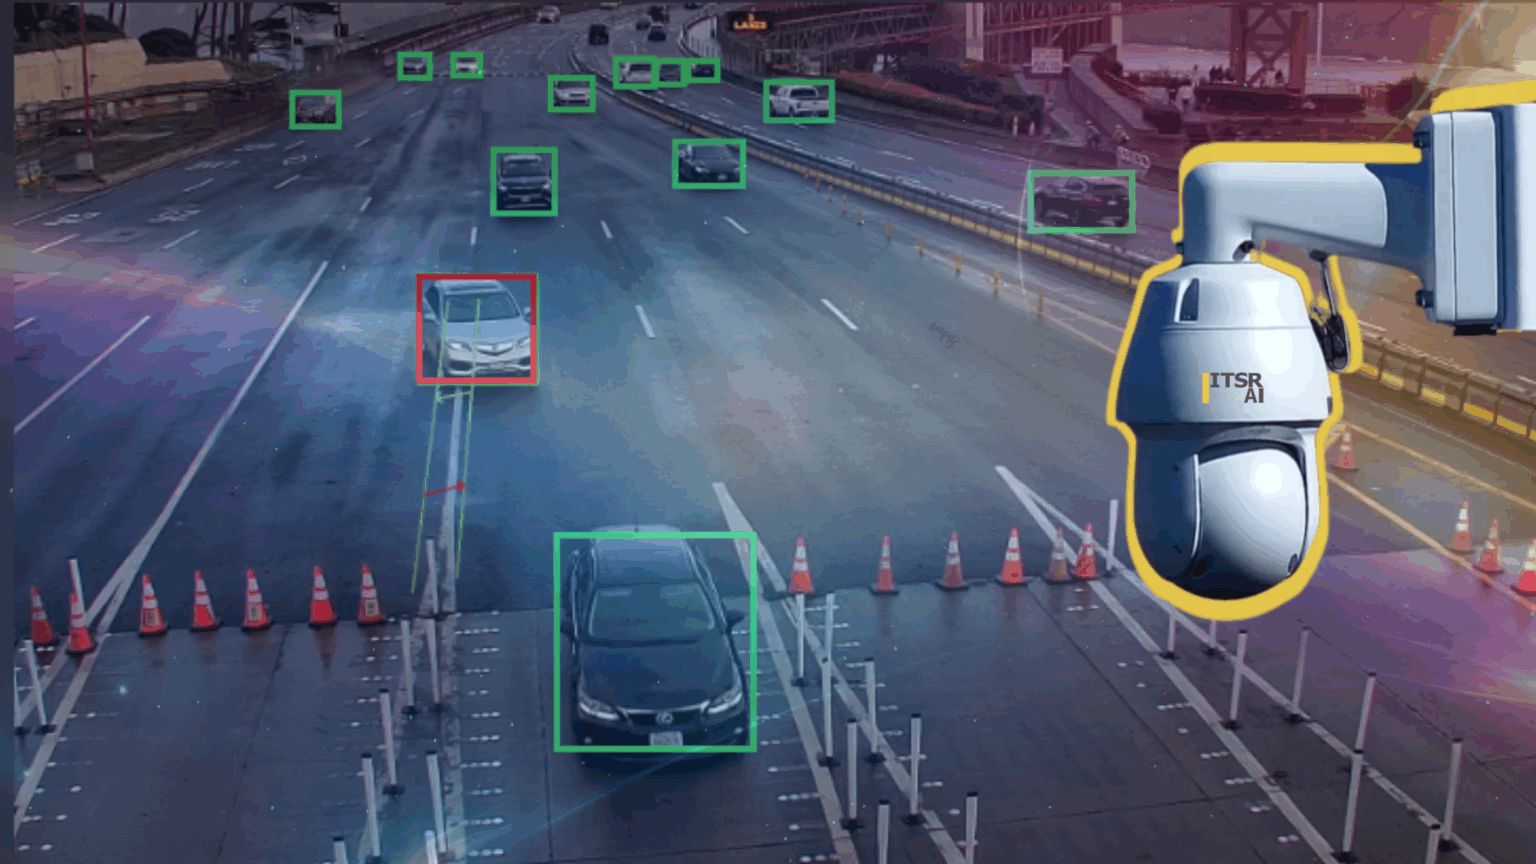
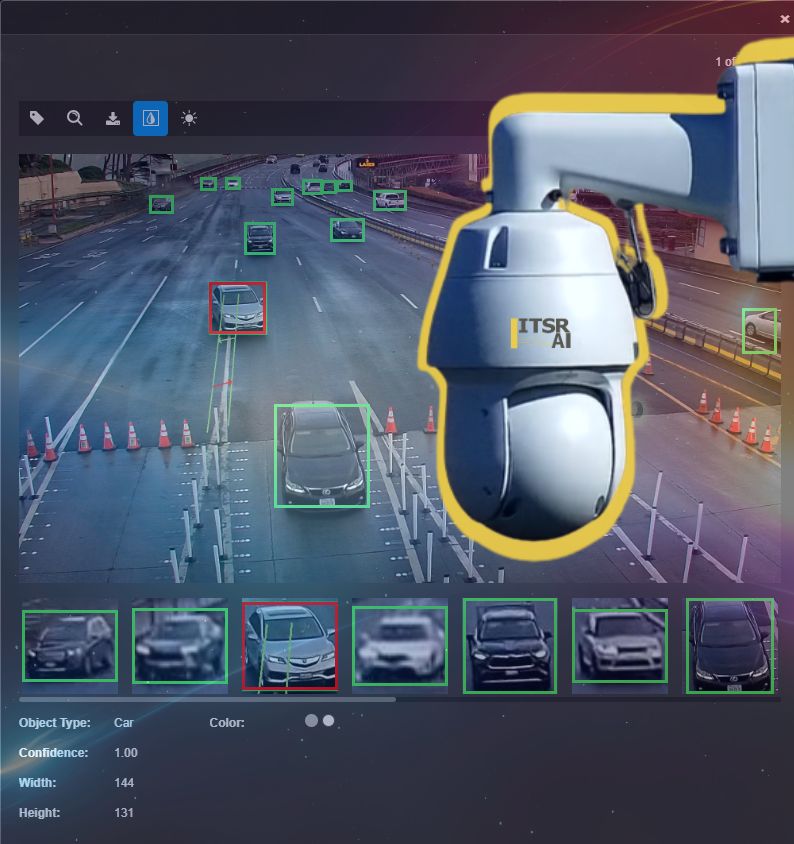
- Multi-lane vehicle counting and classification: car, truck, bus, motorcycle, bicycle
- Pedestrian, bicycle, wheelchair and stroller counting on pathways, crossings and ferry ramps
- Parking and truck-lot occupancy by space and by zone, with sign and 511 publication
- Toll-lane secondary counts for revenue audit against the electronic toll collection system
- Dwell, queue and bottleneck detection; wrong-way and erratic lane-change alerts; near-miss detection
- Origin-destination and flow analysis across a corridor or facility; gate and campus counts
- Custom model training for agency-specific objects and conditions, validated against incumbent detection
Analytics run at the edge on compact appliances or in the cloud, depending on bandwidth and retention policy. Our sister brand ITSR AI builds and trains the vision models; ITS Roads engineers the cameras, cabinets, networks and monitoring that keep the data flowing.
Three ways agencies use our traffic data

Toll and revenue audit
A secondary, camera-based count on toll lanes gives the agency an independent check on transactions and classification. On a nationally recognized bridge carrying roughly 100,000 vehicles a day, our system runs 24/7 across sixteen monitored lanes and pathways and was adopted after a parallel pilot.
Bridge corridor audit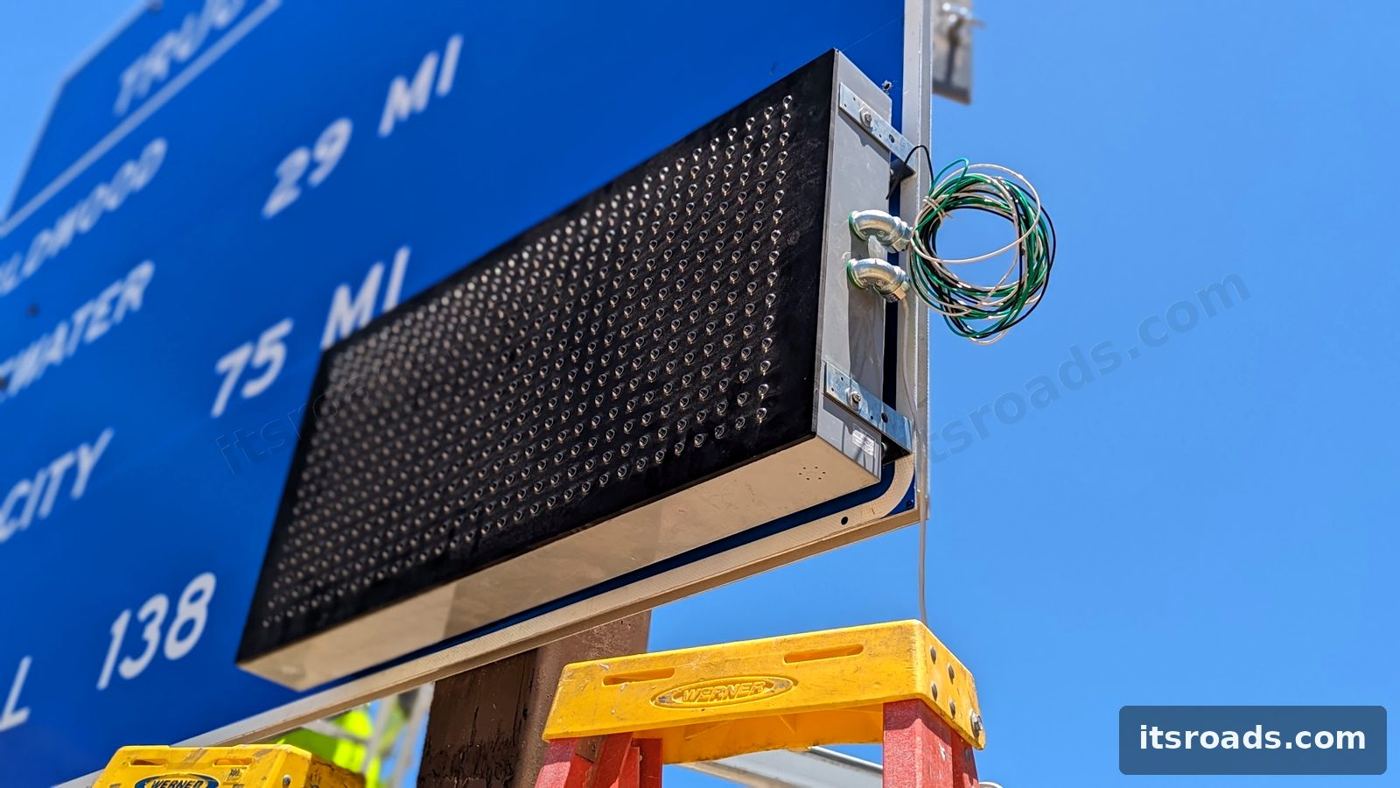
Facility occupancy for Streetline's TPAS
For Streetline's TPAS (truck parking availability system), rest-area and truck-lot occupancy is published to dynamic message signs, 511 and ATMS platforms, with camera-agnostic detection on new or existing cameras and solar or cellular roadside kits where there is no power.
Streetline partnership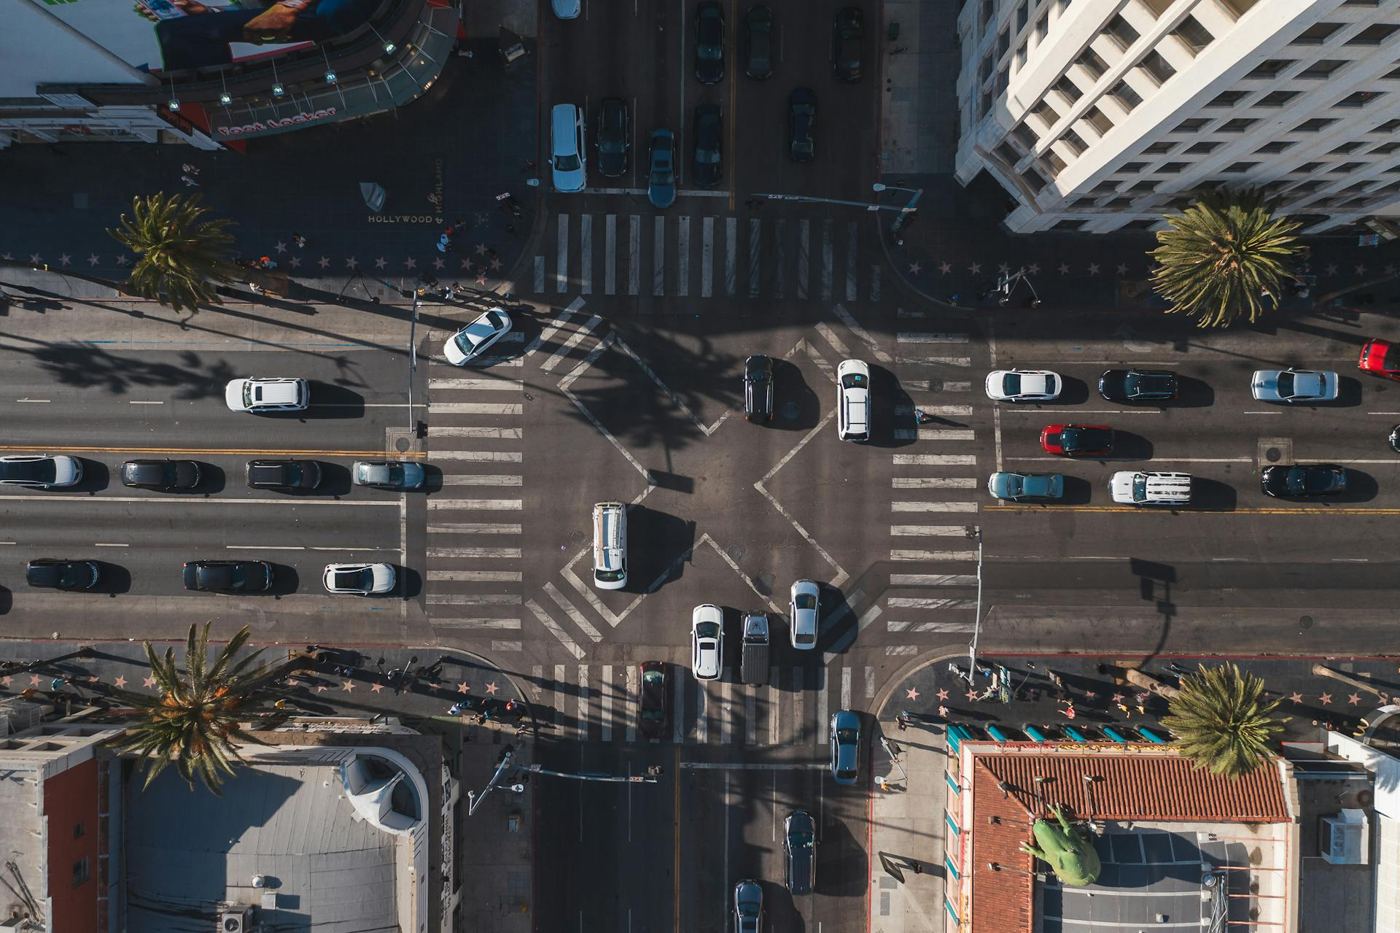
Multimodal counts and planning data
Pedestrian and bicycle counts on bridge paths and at ferry terminals, reconciled to timetables and delivered as scheduled digests, with per-trip boarding and disembarking attribution and no video retained.
Ferry terminal countingThe parts that make video analytics reliable
Most failed analytics pilots fail on the plumbing: the wrong lens, a camera that drops frames at night, a cellular plan that throttles, a switch nobody can reboot remotely. We design the whole chain.
- Camera selection and placement: resolution, frame rate, optics and IR for the detection task; NDAA-compliant options for public agencies
- Roadside cabinets with PoE switching, surge protection, 48 VDC power and dual-SIM cellular or fiber backhaul
- Edge appliances with GPU inference where bandwidth or privacy requires local processing
- VPN, static IP and firewall design so feeds reach the analytics platform securely
- Live monitoring of every camera, switch, router and appliance, with alerting and monthly reporting
- Integration with 511, ATMS, DMS controllers and agency data warehouses
Traffic data FAQ
Can you use our existing traffic cameras?
In most cases yes. Our analytics ingest RTSP, HLS, MJPEG or still images from existing DOT, toll-plaza and facility cameras. We verify resolution, frame rate and field of view, and only add cameras where coverage requires it.
How accurate is camera-based counting?
On a nationally recognized urban bridge corridor, a six-month parallel run against the operator's existing detection system showed 95 to 99 percent agreement on vehicle counts and classification, with no lane closures or pavement work.
Is video recorded?
Our standard design retains counts and detection metadata, not video, and uses no facial recognition. Retention and privacy settings are configured to the owner's policy.
How is the data delivered?
Dashboards, scheduled digests, CSV export and APIs, plus NTCIP 1206 and 2306 feeds to 511 and ATMS platforms, and NTCIP/SNMP control of dynamic message signs.
Ready to scope it?
Send us the corridor, the site count and the problem. We will come back with an approach, not a brochure.