
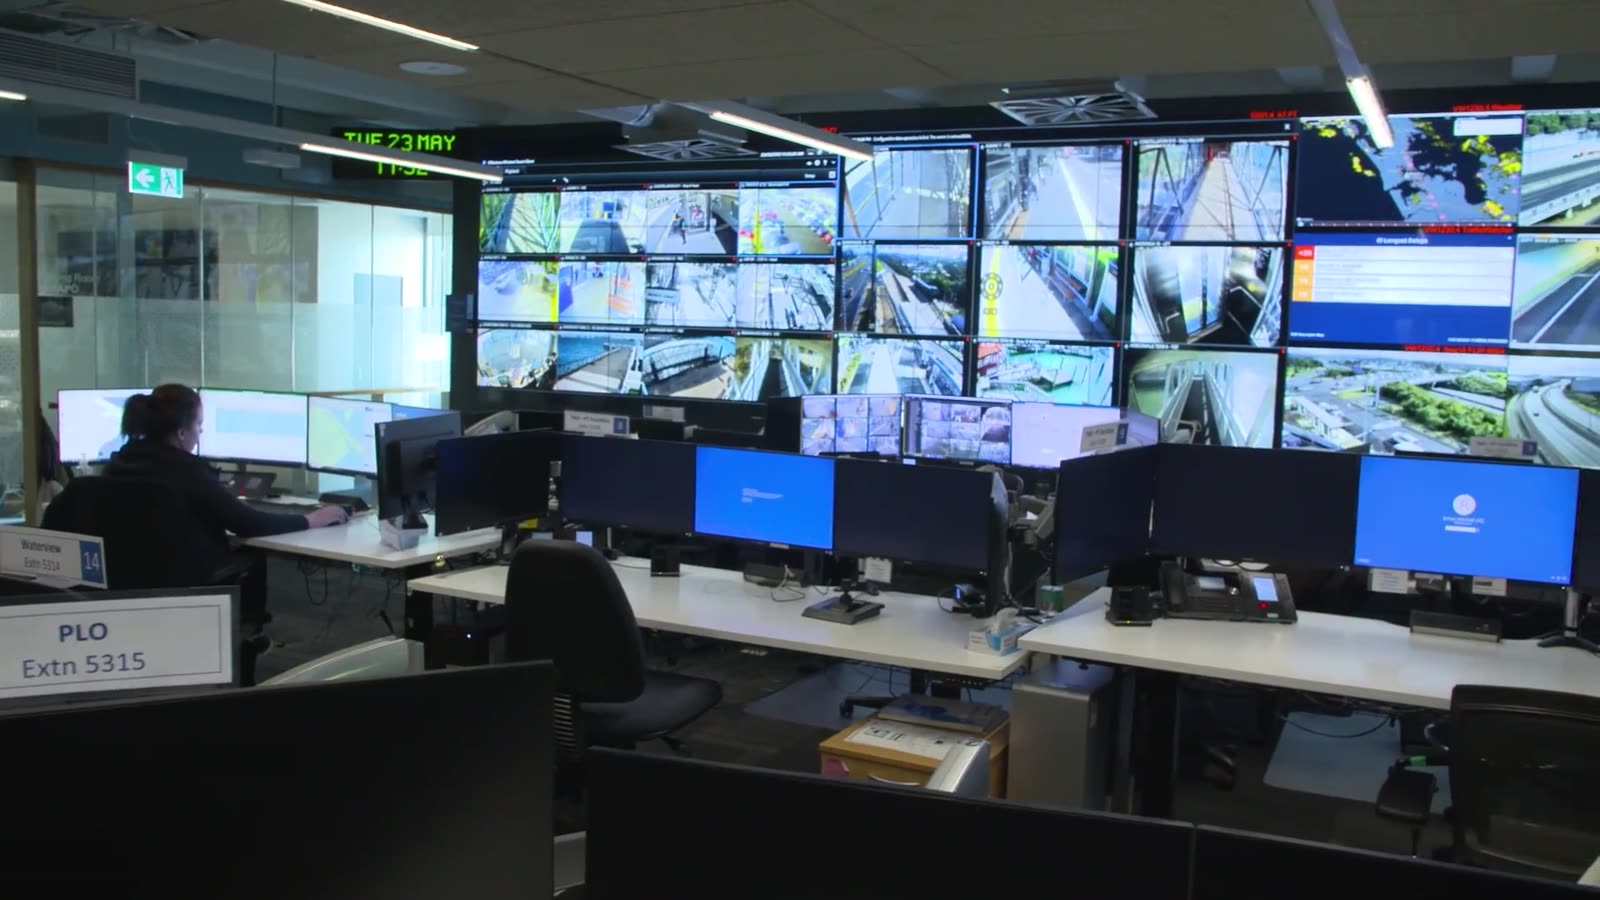
Live monitoring for every node, from a thousand to a hundred thousand
We are proficient in SNMP and the standards around it, and we bring hands-on experience with the state-of-the-art open-source and commercial enterprise monitoring platforms. We use them to give local and state agencies, toll operators, communications companies and private owners a live picture of every device they own: roadside, facility, data center and cloud, including the LANs behind their firewalls.
The right platform for your estate, not the one we happen to sell
Enterprise monitoring is a mature field with excellent open-source and commercial platforms. We have evaluated, deployed or integrated with the major ones and the device managers that ITS and connected-vehicle vendors ship with their products. We choose per agency, based on scale, licensing, staff skills and what you already own, then build the templates, dependency model and reporting around your operations.
Any protocol, any device
SNMP v1, v2c and v3 with authentication and privacy per RFC 3414[8], ICMP, HTTP and TLS checks, the NTCIP 1200-series object sets for signal controllers, signs, environmental sensors, cameras, detectors, lighting and roadside units[6], syslog, NetFlow, sFlow and IPFIX for backhaul utilization[11], REST and JSON APIs, MQTT and Modbus for cabinet controllers, agents on servers and edge computers, IPMI and Redfish for hardware, and SSH or serial scraping for the devices that speak nothing else. If it has an address, we can watch it.
Scale without alarm storms
Discovery rules and templates that apply one set of items and triggers across thousands of devices; dependencies that follow the network topology so a gateway outage raises one alarm; distributed collectors and partitioned storage for estates in the tens to hundreds of thousands of nodes; history and trend retention tuned so a year of data stays fast.
Reports people act on
Dashboards for operators and management, email, SMS, Teams, Slack and webhook escalation by severity, maintenance windows, and automated monthly workbooks: availability per device and corridor, problem events by type, mean time to acknowledge and repair, trends across months, and the short list of devices that need a truck roll.
How we monitor a LAN you will never expose
Agencies rightly refuse inbound connections to field networks. Our reference architecture never asks for one.
Layer 1Field devices
Roadside units, signal controllers, signs, cameras, detectors, UPS units, PoE switches, cellular gateways, cabinet sensors, toll lane equipment, servers.
ITS Roads: device templates, credentials, discovery rules
Layer 2Collector on your LAN
A hardened proxy or collector inside the agency network polls locally, buffers if the link drops, and initiates outbound-only encrypted sessions. No inbound firewall rules, no device credentials leaving the LAN.
ITS Roads: collector design, hardening, zoning per NIST SP 800-82[3]
Layer 3Monitoring platform
Open-source or commercial enterprise platform on your servers, on an appliance we ship, or in our NOC. Topology-aware triggers, event correlation, SLA calculation, long-term trends, role-based multi-tenant views.
ITS Roads: platform selection, templates, dependency model, upgrades
Layer 4People and systems
Operators, maintenance crews, management, vendors and contractors see what they are entitled to. Alerts flow to email, SMS, Teams, Slack, ticketing and paging. Monthly reports land in inboxes without anyone asking.
ITS Roads: NOC operations, remote remediation, reporting
Designed to current federal guidance for operational technology: zones and conduits, no internet-exposed OT, phishing-resistant multi-factor authentication and least privilege[4].
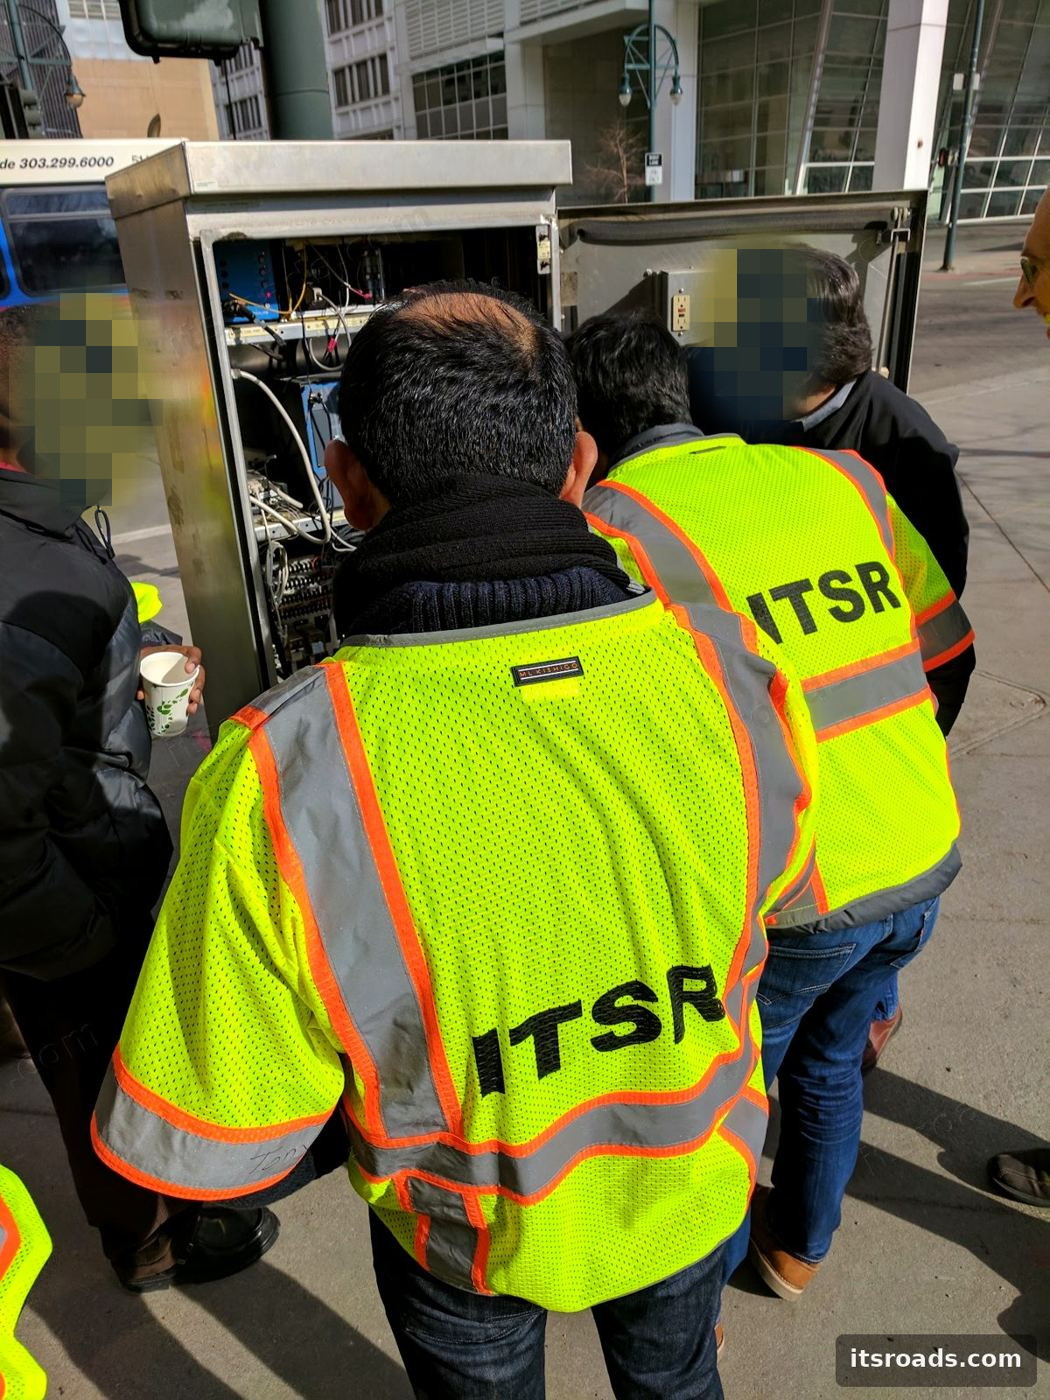
Two estates, one approach
Statewide connected-vehicle network, Colorado DOT. Vendor-neutral templates monitoring 512 roadside units and 436 cellular network interface devices over SNMPv3 and ICMP: more than 10,000 live items and 11,000 triggers, automated RSU-to-gateway dependencies, discovery rules by region and vendor, a development-to-production migration, an O&M responsibility matrix and automated monthly uptime, problem and trend reports.
Bridge and ferry camera estate on the West Coast. A monitoring appliance shipped to site with an encrypted tunnel to our NOC, SNMP, ICMP and HTTP templates for routers and cameras, a custom check for switches with no SNMP, bandwidth-anomaly triggers, hardened TLS portal, and email plus SMS escalation.
Why agencies add an independent monitoring layer
USDOT's connected-vehicle pilots found that large-scale device management, performance tracking, anomaly detection and communications-reliability monitoring are essential, and that over-the-air updates, event recording and RF monitoring were "new areas not covered by the standards", which left agencies dependent on single-vendor portals[1]. One pilot built its own dashboard because nothing off the shelf covered it; another lesson was blunt: “simply rebooting is not a solution”[1]. Florida DOT later built a statewide RSU health and certificate monitor precisely to get one view across vendors[2].
The gaps agencies commonly report in vendor device managers are the ones an enterprise platform closes: no cross-vendor view, nothing for the switches, modems, UPS and cabinets the devices depend on, no trigger dependencies, little long-term history, no SLA reporting, and no integration with ticketing and paging. USDOT's own lessons learned recommend augmenting roadside units with traditional ITS monitoring[15]. That is what we build.
Connected-vehicle monitoring and message decoding-
- ATMS serversDatabasesHypervisorsSCMS connectivityBackups
- Core and distribution switchesRoutersFiber optical power[12]Link utilization
- Signal controllersDynamic message signsWeather stationsCCTVDetectorsLightingToll lane equipment
- Radio state and channel[13]GNSS fixFirmwareCertificate expirySPaT / MAP / TIM / BSM countsMessage decoding
- Availability by corridorEscalationMaintenance windowsMonthly workbooks
Interactive: click a node to expand or collapse.
The same discipline watches a toll plaza, a carrier's field estate or a campus
Every capability built for a state DOT applies to a toll agency's lanes and hosts, a cable operator's remote cabinets, a utility's substation sensors, a port's gates and cameras or an enterprise's branch routers. We design the templates, the dependency model and the reporting around the owner's operations, then run it from our NOC or hand it over with training.
- Physical, wireless and logical network design: fiber and copper plant, cellular, 5.9 GHz, CBRS, point-to-point links, VLANs, QoS, routing, VPN
- Secure remote access for field technicians with least privilege and audit
- Vulnerability assessment and NIST Cybersecurity Framework alignment for field networks
- White-label monitoring and reporting under the client's brand
- Real-time monitoring for current and legacy toll systems: see toll system support
Monitoring FAQ
Do we have to buy a specific monitoring product?
No. We are vendor-neutral. We work with state-of-the-art commercial and open-source enterprise monitoring systems and with the ITS-vendor device managers already in your traffic management center, and we recommend per agency based on scale, staff skills, licensing and what you already own. We bring experience with all of them.
Can you monitor devices on our private LAN without opening inbound ports?
Yes. A hardened collector or proxy on your LAN polls devices locally and pushes results outbound only, over TLS or a VPN, so no inbound firewall rules are required. The collector buffers data if the link drops and forwards it when the link returns. For the most sensitive networks we design one-way flows and jump-host access in line with NIST SP 800-82 and current CISA guidance for operational technology.
How many devices can you monitor?
The platforms we deploy document estates from a few hundred devices to hundreds of thousands of nodes using distributed collectors and partitioned storage. The largest single network we operate today carries more than 10,000 live metrics and 11,000 triggers across roughly a thousand connected-vehicle and network devices for one state DOT, and the same architecture scales out for carriers, utilities and enterprise estates.
Do roadside units from different vendors show up in one view?
Yes. We poll the NTCIP 1218 and RSU Specification 4.1 object sets over SNMPv3, add vendor APIs where they expose more, and place the RSUs in the same topology as the switches, cellular gateways, UPS units and cabinet sensors they depend on.
What stops an alarm storm when a cellular link or a hub switch drops?
Topology-aware trigger dependencies. The parent device raises one alarm and the dependent devices are suppressed, so operators get a single page on the root cause rather than hundreds of symptoms. On one statewide network this logic turns a gateway outage into one event instead of a storm.
How do we prove uptime to management, a funding agency or a contractor?
Service-level reports compare target availability to measured availability, exclude planned maintenance windows, and roll up by device, corridor, district or vendor. We deliver monthly uptime, problem-event and trend workbooks automatically.
What about cabinet conditions, not just IP devices?
Temperature, humidity, door, water, surge-protector state and UPS battery health are collected over SNMP and Modbus from cabinet sensors, PDUs and UPS units, alongside PoE budgets and optical power on fiber links.
What does the managed NOC include?
Alerting by email, SMS, Teams, Slack or webhook with severity-based escalation, monthly performance and problem reports, quarterly template maintenance, remote remediation of routers, switches and cameras, cellular account management, and a shared view for your staff. Clients keep ownership of templates, data and credentials.
- USDOT, Connected Vehicle Pilot Deployment Program: RSU Lessons Learned and Best Practices (FHWA-JPO-20-804, 2020)
- Florida DOT, statewide RSU Health Monitoring System (2023)
- NIST SP 800-82 Rev. 3, Guide to Operational Technology Security (2023)
- CISA, FBI, EPA and DOE: Primary Mitigations to Reduce Cyber Threats to Operational Technology (May 2025)
- NIST SP 800-207, Zero Trust Architecture
- NEMA, NTCIP Transportation Management Protocols family (1103, 1201 to 1218)
- ITE, Roadside Unit (RSU) Standard v01 (NTCIP 1218), September 2020
- IETF RFC 3414, User-based Security Model for SNMPv3
- IETF RFC 1628, UPS Management Information Base
- IETF RFC 3621, Power Ethernet MIB
- IETF RFC 7011, IPFIX protocol specification for flow export
- SNIA SFF-8472, digital diagnostic monitoring for optical transceivers
- FCC 24-123, Second Report and Order on C-V2X in 5.895 to 5.925 GHz (November 2024)
- ISO 15784-2:2024, centre-to-field SNMP data exchange for ITS roadside devices
- USDOT ITS Knowledge Resources: augment RSUs with traditional ITS monitoring (lesson learned)
Ready to scope it?
Send us the corridor, the site count and the problem. We will come back with an approach, not a brochure.